Spatial Analysis and Cartography: Creating China's Annual Precipitation Distribution Map
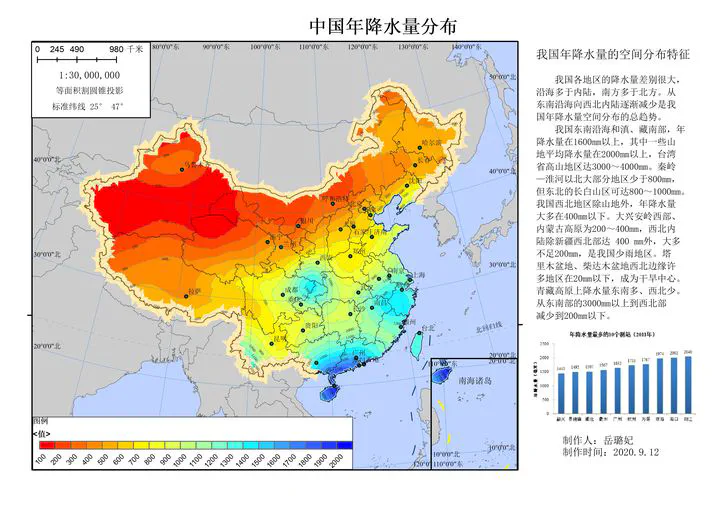
For this project, I undertook a complete GIS workflow to produce a high-quality thematic map of China’s annual precipitation. The process began with extensive data preparation, where I sourced, cleaned, and processed vector data for national boundaries, rivers, and meteorological stations, establishing an Albers Equal Area projection for accuracy. A key part of this stage was building a custom, cartographically sound base map that correctly represented all of China’s territories, including the South China Sea Islands via an inset map.
The core of the analysis involved transforming point data from weather stations into a continuous surface. I used the advanced geostatistical method of Co-kriging, leveraging elevation as a secondary variable to create a more accurate precipitation model. Finally, I focused on detailed cartographic design in ArcGIS, classifying the data with an intuitive color scheme, generating and labeling contour lines (isohyets), and assembling a polished final map layout with all essential elements. The resulting map effectively visualizes complex environmental data through clear and professional cartography.