The Correlation between IMD and Education Levels
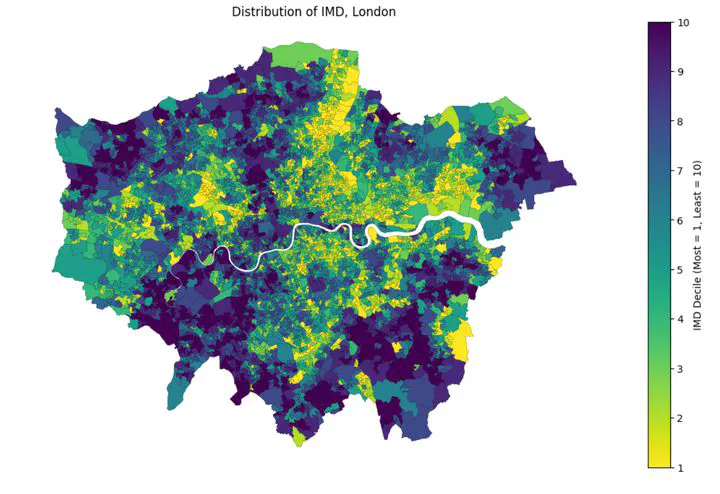
In this project, I investigated the link between socioeconomic deprivation and educational attainment in London. Using Python libraries like Pandas and GeoPandas, I integrated Index of Multiple Deprivation (IMD) data, census statistics on qualifications, and LSOA boundary shapefiles to create a comprehensive dataset for analysis. My goal was to quantify this relationship statistically and visualize it geographically. My analysis followed a two-step process. An initial Spearman’s rank correlation test across all education levels did not yield a statistically significant result. However, a deeper dive using a boxplot to compare deprivation with the percentage of residents having no qualifications revealed a clear trend: more deprived areas consistently have a higher proportion of people with no formal education. To visualize this spatially, I created a choropleth map, which showed a distinct concentration of high deprivation in inner and eastern London, contrasted with more affluent areas on the city’s outskirts. This project highlights the importance of combining different analytical techniques to uncover nuanced patterns and provides a clear, data-driven map for understanding social inequality in London.