Geodemographic Classification for Social Impact: Targeting Youth Support in Leeds
🛠 Skills & Tools: SPSS ArcGIS Pro Census Data Analysis Geodemographics Social Policy
Precision Targeting for Social Aid
Client: Learning Partnerships (Leeds-based charity)
In a time of limited resources, a one-size-fits-all approach to social aid is inefficient. Learning Partnerships faced a critical operational challenge: they had launched a support initiative for disadvantaged young adults, but lacked the granular data needed to deploy their teams effectively.
My goal was to transform raw census data into an actionable, location-based strategy, pinpointing neighbourhoods with the highest concentration of at-risk youth.
Methodology: Statistical Rigour
My approach shifted from statistical abstraction to geographic reality. I selected key census variables acting as proxies for disadvantage, such as unemployment and educational attainment, and applied the K-means clustering algorithm in SPSS.
1. Model Validation
Before interpreting the results, it was essential to verify the statistical validity of the segmentation.
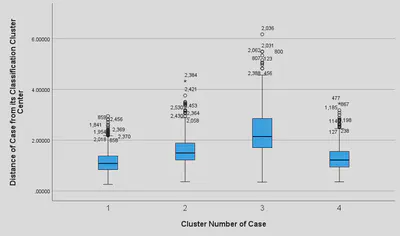
Figure 1 (below) illustrates the distance of cases from their respective classification clusters using a boxplot. The relatively tight distribution, particularly among our target groups, confirms that the mathematical clusters are cohesive and that the model has successfully grouped diverse neighbourhoods together meaningfully.
Identifying the Target Group
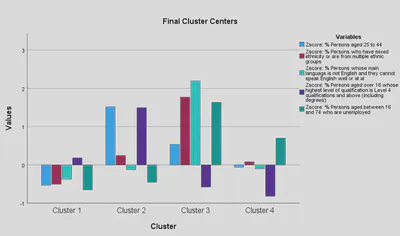
The clustering process revealed four distinct demographic profiles. Upon analysing the Z-scores of the variables (see Figure 2), Cluster 3 immediately stood out as the charity’s primary target.
Profile: The ‘Multilingual Multicultural Unemployment’ Cluster
As shown in the bar chart below, Cluster 3 (the tall bars in the middle) shows a significant deviation from the average:
- Highest Unemployment: The teal bar shows a massive spike in unemployment among 16-74 year olds.
- Language Barriers: The light blue bar indicates a high percentage of residents who cannot speak English well.
- Young Demographics: Significant density of persons aged 25-44.
Impact: From Data to Strategy
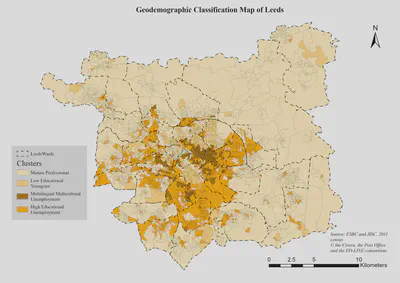
The final step was to use ArcGIS Pro to bring these statistics to life. By joining the classification data to the geographic boundaries of Leeds, I produced a clear visual map for the charity’s stakeholders.
The map shows that the target group (Cluster 3, represented in dark brown) is not randomly scattered. Instead, it forms a solid, actionable zone concentrated in inner-city Leeds.
Outcome
This project provided Learning Partnerships with a robust evidence base.
- Strategic Focus: The charity shifted from a city-wide approach to a targeted campaign in the inner-city ‘Dark Brown’ zones.
- Tailored Service: Understanding the ‘Multilingual’ nature of Cluster 3 allowed them to recruit staff with relevant language skills.
- Social Impact: Resources were successfully redirected to the communities with the most acute needs.